Raman spectroscopy is an analytical technique that scientists use to study materials without touching or harming them. Think of it as a magical lens that lets us see the tiny parts inside things like medicines, crystals, or even rocks.
This comprehensive guide will help everyone understand Raman spectroscopy, from the very basics to the advanced.
What is Raman Spectroscopy?
Raman spectroscopy is a powerful analytical technique that can be used to identify and characterize materials at the molecular level.
It is based on the inelastic scattering of light, which occurs when a photon of light interacts with a molecule and loses or gains energy. The amount of energy lost or gained is characteristic of the molecule’s vibrational modes, which can be used to identify its structure and composition.
Being a non-destructive technique the samples do not need to be prepared in any special way. It is also very sensitive, which means that it can be used to analyze very small samples.
History of Raman Spectroscopy
The story of Raman spectroscopy starts in the early 20th century and is tied closely to advancements in the understanding of light and its interaction with matter.
Foundations in Light Scattering
Long before the discovery of the Raman effect, scientists were delving into the phenomena of light scattering. The understanding that light could scatter upon interacting with matter was well-established. However, the specifics of how and why this scattering occurred at different wavelengths were yet to be explored in detail.
Discovery of the Raman Effect
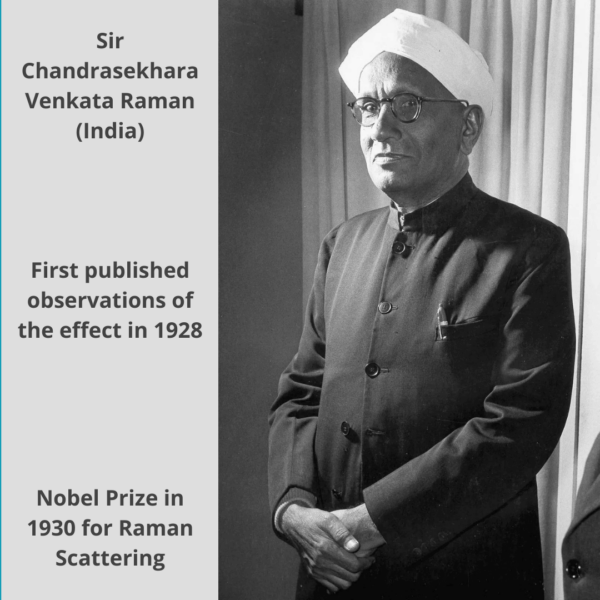
The breakthrough came in 1928 with the Indian physicist Sir Chandrasekhara Venkata Raman. While working with his colleague, K. S. Krishnan, at the Indian Association for the Cultivation of Science in Kolkata, India, Raman was investigating the scattering of light by liquids.
During their experiments, they noticed that when a monochromatic light (in their case, sunlight filtered to one specific color) passed through certain liquid samples, a tiny fraction of the light scattered was of a different color (or wavelength) than the incident light. This change in wavelength was due to the energy exchange between light and the molecules in the liquid, causing the light to scatter at a shifted wavelength. This phenomenon, a specific type of inelastic scattering, was named the “Raman effect” in honor of its discoverer.
Recognition and Further Development
Raman’s discovery was groundbreaking, providing a new tool for understanding molecular structures based on their vibrational energies. In recognition of his significant contribution to the field of physics, C.V. Raman was awarded the Nobel Prize in Physics in 1930.
After its discovery, the Raman effect became a subject of intensive research. The development of lasers in the 1960s gave a significant boost to Raman studies. Lasers provided a powerful and monochromatic light source, which increased the sensitivity and specificity of Raman measurements.
Modern Raman Spectroscopy
The evolution from using sunlight in Raman’s initial experiments to advanced laser-driven instruments of today has been tremendous. Modern Raman spectroscopy, equipped with sophisticated detectors, high-resolution spectrometers, and advanced software, can probe the intricacies of molecular structures with unparalleled precision.
Basic Principle Behind Raman Spectroscopy
Raman spectroscopy is based on inelastic scattering of light, specifically the scattering of monochromatic light (usually from a laser) off molecules in a sample.
When light is scattered from a molecule, most photons are elastically scattered, meaning they retain their original energy (and thus frequency or wavelength). This elastic scattering is known as Rayleigh scattering.
However, a small fraction of the light is inelastically scattered, meaning the photons have exchanged energy with the molecules, either giving energy to the molecules (Stokes scattering) or gaining energy from the molecules (Anti-Stokes scattering). This change in energy appears as a shift from the incident frequency and corresponds to the vibrational energies of the molecules in the sample.
![]()

This inelastically scattered light provides the Raman spectrum, which contains peaks corresponding to the vibrational modes of the molecules. The positions and intensities of these peaks provide information about the molecular vibrations, and thus about the molecular structure of the sample.
Quick Revision
Elastic Scattering (Rayleigh Scattering): When light interacts with a molecule and scatters without any change in energy (or frequency), it is termed elastic scattering. The scattered light remains at the same frequency as the incident light.
Inelastic Scattering (Raman Scattering): When light interacts with a molecule and there’s an exchange of energy between the light and the molecule, the scattering is termed inelastic. The scattered light can either have a higher frequency (if it gains energy, termed Anti-Stokes Raman scattering) or a lower frequency (if it loses energy, termed Stokes Raman scattering) compared to the incident light.
Raman Shift: The Raman shift is a measure of the change in energy experienced by light when it interacts with a molecule, resulting in the light being scattered at a frequency different from its incident frequency. This shift in energy, or frequency, is a direct result of the molecule’s vibrational modes and is the basis for Raman spectroscopy.
Vibrational modes of molecules help in Raman spectroscopy by providing a unique fingerprint for each molecule. The Raman shift is specific to the vibrational modes of the molecule. Thus, a Raman spectrum, which plots the intensity of scattered light against the Raman shift, provides a unique “fingerprint” for the molecule, allowing for its identification and structural analysis.
Note that the Raman effect and the resulting Raman spectra arise from this inelastic scattering of light. The energy differences in the inelastic scattering correspond to the vibrational energies of molecules, which makes Raman spectroscopy a powerful tool for studying molecular structures and dynamics. (Read the comparison between Raman and Rayleigh scattering)
Instrumentation of Raman Technique
A Raman spectrometer is an instrument used to perform Raman spectroscopy. It consists of the following main components:
- Laser source: The laser source provides a monochromatic (single wavelength) light beam that is used to excite the sample.
- Sample stage: The sample stage is where the sample is placed for analysis.
- Spectrometer: The spectrometer disperses the scattered light from the sample into its constituent wavelengths.
- Detector: The detector measures the intensity of the scattered light at each wavelength.
- Computer System: Processes the signal from the detector, generates the Raman spectrum, and allows for data analysis. Modern software also aids in comparing obtained spectra with known reference spectra for compound identification.

The Raman spectrometer works by directing the laser beam onto the sample. When the laser light interacts with the sample, it can be scattered in two ways: elastically and inelastically.
The scattered light from the sample is collected by the spectrometer and dispersed into its constituent wavelengths. The detector then measures the intensity of the scattered light at each wavelength.
The Raman spectrum of a molecule is unique to that molecule, and it can be used to identify and characterize the molecule.
How to Prepare Sample for the Procedure
Sample preparation for Raman spectroscopy is crucial as the quality of the results heavily depends on the quality of the sample and its preparation. The preparation can vary depending on the type of sample (solid, liquid, or gas) and the specific requirements of the analysis. Here are general guidelines for various samples:
- Solids
- Bulk Materials: Many solids can be analyzed directly without any specific preparation. Simply place the solid in the spectrometer’s sample holder.
- Powders: For powders, it’s often best to press them into a pellet, possibly using a hydraulic press. You can also sprinkle the powder onto an adhesive tape or mix it with a suitable liquid for a paste-like consistency, which can then be spread onto a substrate.
- Thin Films: Place them directly onto a suitable substrate, like a glass slide.
- Liquids:
- Place a drop of liquid between two transparent plates or in a shallow well. Ensure that the liquid thickness allows optimal light penetration and scattering collection.
- Use a quartz or glass cuvette for larger volumes.
- Gases:
- Enclose the gas in a transparent cell, often made of quartz, ensuring it is sealed correctly to prevent leakage.
- Adjust the pressure if necessary.
Common Challenges in Sample Preparation and Solutions
While Raman spectroscopy can be an incredibly versatile and non-destructive analytical technique, careful sample preparation is key to obtaining accurate and reliable results. Addressing common challenges ensures that the spectra obtained represent the true characteristics of the sample.
- Fluorescence: Some samples can produce a strong fluorescence background that might overpower the Raman signal.
- Solution: Adjust the excitation wavelength. Using a near-infrared or ultraviolet laser can often help reduce fluorescence. Another option is to change the detection range or use special filters.
- Sample Heating: The laser can heat the sample, especially if it’s highly absorbing or if the laser power is too high.
- Solution: Reduce the laser power or use a different wavelength that’s less absorbed by the sample. A rotating sample holder can also help in evenly distributing the heat.
- Photo-degradation: Some samples, especially biological or organic ones, can degrade upon exposure to the laser.
- Solution: Minimize exposure time, reduce laser power, or use a different excitation wavelength that’s less damaging to the sample.
- Sample Movement: In cases of liquid samples or volatile compounds, there can be movement during the measurement.
- Solution: Ensure the sample is properly secured and sealed. Using a higher viscosity medium or matrix can help reduce movement in liquids.
- Substrate Interference: The substrate or background can sometimes contribute to the Raman spectrum, interfering with the sample’s signal.
- Solution: Use a substrate material that has minimal Raman activity in the region of interest or one that’s clearly distinguishable from the sample.
- Particle Size in Powders: The particle size in powdered samples can affect the Raman signal due to differences in scattering efficiencies.
- Solution: Ensure a consistent particle size, possibly through grinding or sieving, to get a uniform signal.
- Sample Concentration: In liquids, if the concentration is too high, there can be issues with overlapping spectra or too intense signals.
- Solution: Dilute the sample to an optimal concentration that provides clear and distinguishable peaks.
Interpreting Raman Spectra
Understanding and interpreting Raman spectra is pivotal for extracting meaningful information about the molecular structure and characteristics of a sample. The Raman spectrum offers a graphical representation of the Raman shift (usually in wavenumbers, cm⁻¹) versus the intensity of scattered light.

Basics of Spectral Analysis
Baseline: The first step in spectral analysis is to identify and, if necessary, correct the baseline. A flat baseline indicates no fluorescence or other background interference.
Raman Shift: The x-axis typically represents the Raman shift, with peaks indicating where the light scattering has changed due to molecular vibrations.
Intensity: The y-axis depicts the intensity of scattered light. Peaks with higher intensity signify stronger vibrational modes or higher concentrations of the particular molecular bond causing that vibration.
Identifying Peaks and Their Significance
Peak Position: The position of a peak on the x-axis (its Raman shift) indicates the frequency of a particular vibrational mode. Different molecular bonds and molecular structures will produce peaks at characteristic frequencies.
Peak Width: The width of a peak can provide information about the environment around the vibrating bond. Broader peaks suggest a more disordered structure, or in some cases, instrumental broadening.
Peak Shape: Asymmetry in peak shapes can be indicative of multiple overlapping peaks or interactions between different vibrational modes.
Peak Intensity: A more intense peak suggests a higher concentration of the particular bond or group causing that vibrational mode. It can also indicate a particularly strong or polar bond.
Common Challenges and Solutions
1. Fluorescence Background: One of the most common challenges in Raman spectral analysis is the presence of a fluorescence background, which can overshadow the actual Raman peaks.
Solution: Using a different excitation wavelength (e.g., switching to near-infrared or ultraviolet) can help reduce or eliminate the fluorescence.
2. Overlapping Peaks: Sometimes, two or more vibrational modes can produce peaks at nearly the same position, making them hard to distinguish.
Solution: Advanced deconvolution techniques can separate overlapping peaks. Using a spectrometer with higher resolution can also help.
3. Noise: Low signal-to-noise ratio can make it difficult to distinguish real peaks from random fluctuations.
Solution: Averaging multiple scans can help reduce noise. Ensuring optimal sample preparation and using higher laser power (without damaging the sample) can increase signal strength.
4. Peak Assignment: Assigning peaks to specific molecular vibrations can sometimes be ambiguous, especially for complex molecules.
Solution: Comparing the spectrum with reference spectra, either from a database or literature, can aid in peak assignment. Additionally, using computational methods to simulate expected Raman spectra for the molecule in question can offer guidance.
Vibrational Modes and Raman Spectroscopy
Vibrational modes refer to the various ways molecules can move. When atoms are bonded together in a molecule, they do not remain static but instead exhibit specific movements. These movements arise from the energy associated with the bonds holding the atoms together.
Types of Vibrational Modes
Stretching: This involves a change in the distance between two atoms. It can be further divided into:
- Symmetrical (or symmetric) Stretch: Both atoms move outwards or inwards simultaneously.
- Asymmetrical (or asymmetric) Stretch: One atom moves outwards while the other moves inwards, or vice versa.
Bending: This involves a change in the angle between three atoms. Bending can be categorized as:
- Scissoring (in-plane bend): Atoms move towards or away from each other.
- Rocking (in-plane bend): One end of a group of atoms remains stationary while the other end moves.
- Wagging (out-of-plane bend): Atoms move in and out of the plane of the paper/screen.
- Twisting (out-of-plane bend): Atoms move about an axis perpendicular to the molecular plane.
Factors Affecting Vibrational Modes
- Mass of Atoms: Heavier atoms vibrate at lower frequencies than lighter ones.
- Bond Strength: Stronger bonds, like triple bonds, vibrate at higher frequencies than weaker bonds, like single bonds.
Importance of Vibrational Modes in Spectroscopy
Each molecule has a unique set of vibrational modes that give rise to specific vibrational frequencies. These frequencies can be thought of as the molecule’s “fingerprint.”
When subjected to infrared (IR) or Raman spectroscopy, these vibrational frequencies become evident, allowing scientists to determine the types of bonds and functional groups present in the molecule.
Quantification of Vibrational Modes
The number of vibrational modes a molecule can have depends on the number of atoms in the molecule. For a non-linear molecule with N atoms, the number of vibrational modes is 3N−6. For a linear molecule, it’s 3N−5.
Overtones and Combination Bands
In addition to the fundamental vibrational frequencies, molecules can also exhibit overtones (multiples of a fundamental frequency) and combination bands (sum or difference of two fundamental frequencies). These are usually weaker in intensity but can provide additional information about the molecular structure.
In other words, the vibrational modes of molecules provide crucial information about the molecular structure and are extensively used in various spectroscopic techniques, like IR and Raman spectroscopy, to identify and analyze substances.
Types of Raman Spectroscopy
The basic Raman spectroscopic technique has been adapted and specialized into various types for specific applications or to overcome particular challenges. Here’s a comparison of some of the specialized Raman techniques to traditional Raman spectroscopy:
1. SERS (Surface-Enhanced Raman Spectroscopy)
What is SERS? SERS is a variation of Raman spectroscopy that uses nanostructured metal surfaces or nanoparticles to amplify the Raman signal of molecules adsorbed on the surface. The enhancement can be so significant that even single molecules can sometimes be detected.
Comparison with Traditional Raman:
- Sensitivity: SERS can offer up to a 10^6 to 10^8 times enhancement in signal, making it much more sensitive than traditional Raman.
- Applications: Due to its high sensitivity, SERS is particularly useful for trace analysis, single-molecule detection, and studying molecular interactions at surfaces.
2. Resonance Raman Spectroscopy
What is Resonance Raman? Resonance Raman spectroscopy involves tuning the excitation wavelength to be close or identical to an electronic transition of the molecule. This results in an enhancement of vibrational modes associated with that electronic transition.
Comparison with Traditional Raman:
- Selectivity: Resonance Raman provides selective enhancement of certain vibrational modes, allowing for focused study of specific parts of a molecule.
- Applications: It’s often used in the study of pigments, dyes, and other colored compounds, as well as biological molecules like hemes or carotenoids.
3. Micro Raman Spectroscopy
What is Micro Raman Spectroscopy? Micro Raman, often known as Raman microscopy, combines Raman spectroscopy with optical microscopy. It allows for the collection of Raman spectra from very small regions of a sample, often down to the micrometer scale.
Comparison with Traditional Raman:
- Resolution: Micro Raman offers spatial resolution on the micrometer scale, allowing for detailed mapping of heterogeneous samples.
- Applications: Widely used in material science, geology, and biology to study the variation in molecular composition across a sample.
4. Coherent Anti-Stokes Raman Spectroscopy (CARS)
What is CARS? CARS is a nonlinear Raman technique where two different laser beams are used to interact with the sample. The difference in their frequencies matches the frequency of a Raman-active vibration in the sample. The resultant scattered light is collected at a frequency that is anti-Stokes shifted.
Comparison with Traditional Raman:
- Speed: CARS is significantly faster than traditional Raman and can even provide real-time imaging.
- Sensitivity: It provides a much stronger signal, making it useful for low-concentration samples.
- Applications: Commonly used in biomedical imaging due to its fast imaging capabilities and ability to provide contrast based on molecular vibrations.
When and Why is Raman Spectroscopy Preferable?
Raman spectroscopy offers unique advantages over other spectroscopic techniques in various scenarios. Here’s when Raman spectroscopy is typically preferred:
Non-Destructive Analysis
Raman spectroscopy stands out as a method that requires minimal to no sample preparation, allowing samples to be analyzed in their natural state. This non-destructive nature ensures that the physical and chemical integrity of the sample remains intact. Whether it’s examining invaluable artworks, historical artifacts, or sensitive biological samples, Raman offers a gentle yet informative approach. This contrasts with other techniques which might demand grinding, dissolving, or other potentially destructive preparations.
Analysis of Aqueous Samples
Raman spectroscopy is particularly advantageous when analyzing biological samples or reactions in aqueous solutions. One reason is that water, which often interferes in other spectroscopic techniques, has a weak Raman scattering effect. In comparison, infrared (IR) spectroscopy struggles in the presence of water since it produces a strong absorption band that can mask other important features in the spectrum.
Mineral and Geological Studies
For geologists and mineralogists, Raman spectroscopy is a tool of choice. It’s adept at identifying a variety of minerals and offers the granularity needed to distinguish among polymorphs. By analyzing geological samples, scientists can obtain insights into the history and processes that shaped our planet, with Raman providing clarity where other methods might falter.
In Situ Measurements
With the development of portable Raman instruments, on-site measurements have become not only possible but also highly effective. This is especially valuable in fields like art restoration or archaeological investigations. Such tools allow experts to analyze and authenticate artifacts and artworks without removing them from their locations or subjecting them to potential damage during transport.
Characterizing Carbon Materials
Raman spectroscopy shines when it comes to characterizing carbonaceous materials. It’s instrumental in distinguishing between various forms of carbon, from the crystalline lattice of diamond to the hexagonal structures of graphite and even the intricate formations of carbon nanotubes or graphene layers.
Transparent Materials
The principle behind Raman—scattering of light rather than absorption—makes it an ideal technique for studying transparent samples. Whether it’s clear polymers used in everyday products or specialized glasses in technological applications, Raman offers a window into their molecular composition and structure without the limitations faced by absorption-based techniques.
Fluorescent Samples
Fluorescence can be a challenge in many spectroscopic methods, often masking crucial information. However, the flexibility in Raman spectroscopy to select various excitation wavelengths provides a workaround. By choosing an excitation wavelength where the sample exhibits minimal fluorescence, analysts can still retrieve valuable Raman signals, ensuring fluorescence doesn’t overshadow the information of interest.
Spatial Resolution
The merging of Raman spectroscopy with microscopy has given birth to Raman microscopy, a technique that boasts spatial resolutions below a micrometer. This capability is indispensable when studying heterogeneous materials or samples where minute structural variations can have significant implications.
Remote Sensing
Raman spectroscopy’s compatibility with fiber-optic probes has expanded its reach—quite literally. These probes can venture into hard-to-access, remote, or hazardous areas, be it the innards of industrial reactors or the depths of our oceans, bringing back crucial data without the need for direct human intervention.
Reaction Monitoring
Offering a real-time view into reactions, Raman spectroscopy has become invaluable in studying reaction kinetics, mechanisms, and pathways. As reactions proceed, the evolving Raman spectra provide a chronological record of molecular changes, giving chemists a dynamic view of reactions as they unfold.
Thick or Opaque Samples
Unlike techniques such as infrared spectroscopy, which can be limited by the penetration depth of the probing light, Raman spectroscopy can delve deeper. Whether it’s analyzing samples that are inherently thick or examining contents through a transparent container, Raman ensures that depth isn’t a barrier to obtaining quality data.
Complementary to IR Spectroscopy
There are vibrational modes, often termed “silent” in IR spectroscopy, that don’t produce a strong signal in an IR spectrum. Raman spectroscopy can detect these modes, providing complementary information and ensuring a more complete vibrational analysis of the sample.
Comparison with Other Spectroscopic Techniques
Spectroscopy, in its many forms, has become a cornerstone of analytical chemistry, offering researchers myriad ways to investigate the structure and composition of materials. Among these, Raman, Infrared (IR), and Ultraviolet-Visible (UV-Vis) spectroscopy are prominent. Here’s how Raman compares up against IR and UV-Vis:
Raman vs. Infrared (IR) Spectroscopy
- Nature of Interaction:
- Raman: Based on the inelastic scattering of monochromatic light.
- IR: Based on the absorption of infrared light by molecules, causing vibrational transitions.
- Vibrational Modes:
- Raman: Detects modes associated with a change in polarizability.
- IR: Detects modes associated with a change in dipole moment.
- Water as a Solvent:
- Raman: Water has a weak Raman signal, making it suitable for analyzing aqueous solutions.
- IR: Water shows strong absorption in IR, making it less suitable for aqueous samples.
- Sampling:
- Raman: Can analyze thick and opaque samples.
- IR: Limited by penetration depth, often requiring thin samples or special techniques like Attenuated Total Reflectance (ATR).
- Instrumentation:
- Raman: Requires a laser for excitation and a monochromator or filter to analyze scattered light.
- IR: Uses a broad-spectrum infrared source and a detector that measures absorption over a range of frequencies.
Raman vs. Ultraviolet-Visible (UV-Vis) Spectroscopy
- Nature of Interaction:
- Raman: Deals with inelastic scattering of light, focusing on vibrational information.
- UV-Vis: Concerned with electronic transitions, where molecules absorb UV or visible light.
- Information Provided:
- Raman: Offers information on molecular vibrations, structure, and polarizability.
- UV-Vis: Gives information about electronic structures, conjugation, and the presence of chromophores.
- Sensitivity:
- Raman: Generally less sensitive than UV-Vis, but techniques like SERS can greatly enhance sensitivity.
- UV-Vis: Highly sensitive to compounds with π-conjugated systems and other chromophores.
- Solvent Use:
- Raman: Many solvents can be used since Raman is more concerned with the solute’s signal.
- UV-Vis: The solvent’s choice is crucial as it must not absorb in the same range as the solute.
- Sample State:
- Raman: Can analyze samples in various states—solids, liquids, or gases.
- UV-Vis: Typically used for liquid samples, but solids can be analyzed with appropriate sample preparation.
Important Applications of Raman Spectroscopy
Pharmaceutical Analysis
Raman spectroscopy has become indispensable in the pharmaceutical industry for its ability to offer rapid, non-destructive analysis. It’s employed in drug development, quality control, and monitoring physical properties of drugs. From identifying active pharmaceutical ingredients to detecting counterfeit products, Raman ensures the safety and efficacy of medications.
Material Characterization
In material science, Raman provides insights into the molecular structure, crystallinity, stress, and temperature of materials. For instance, it’s extensively used to differentiate between the forms of carbon, like graphene, graphite, and carbon nanotubes, providing details about their structural and electronic properties.
Biomedical Diagnostics
Raman spectroscopy’s capacity to analyze biological tissues without the need for dyes or markers has revolutionized biomedical diagnostics. Whether it’s detecting early stages of diseases, such as cancer, or monitoring blood glucose levels non-invasively, Raman offers a promising avenue for real-time diagnostic applications.
Art and Archaeology
Preserving historical and cultural artifacts requires gentle yet effective analytical methods. Raman spectroscopy fits the bill by identifying pigments, inks, and materials in artworks and archaeological finds without damaging these priceless pieces. It helps in authentication, restoration, and understanding the history behind objects.
Environmental Monitoring
Raman spectroscopy aids in monitoring environmental pollutants and assessing water quality. By detecting and quantifying contaminants, be it in water, air, or soil, Raman serves as an early warning system, ensuring timely interventions to mitigate environmental hazards.
Geology and Mineralogy
For geologists and mineralogists, Raman spectroscopy is a window into Earth’s history. It aids in mineral identification, especially in distinguishing among polymorphs. By examining inclusions in gemstones or studying the molecular structure of minerals, Raman provides a deeper understanding of geological processes.
Food and Agriculture
Ensuring food safety and quality is paramount. Raman spectroscopy steps in to detect adulterants, monitor the ripeness of fruits, or even quantify components like fats and proteins in food products. In agriculture, it can be used to analyze soil health or detect diseases in crops.
These are some of the most important applications. Read more applications of Raman spectroscopy here.
Advancements in Raman Spectroscopy
Raman spectroscopy, while powerful in its standard form, has seen numerous advancements and specialized adaptations to cater to specific research needs. Here, we explore some of the advancements that push the boundaries of what Raman can achieve.
Time-resolved Raman technique
Time-resolved Raman spectroscopy is a technique that combines the molecular specificity of Raman with the ability to capture rapid, transient changes in a sample. By using ultra-fast laser pulses, this method can monitor fast chemical reactions, phase transitions, or other dynamic processes in real-time.
This approach allows scientists to track changes in molecular structures on the timescale of picoseconds to nanoseconds, offering insights into rapid processes like photochemical reactions, vibrational relaxations, or short-lived molecular intermediates.
2D Raman Imaging
2D Raman imaging, often known as Raman microscopy or Raman mapping, is a spatially-resolved technique that constructs a two-dimensional image of a sample based on Raman spectra obtained from each point. By scanning the laser beam across the sample and collecting a spectrum at each position, a detailed map of the chemical composition and structure over the sample’s surface is produced.
This method is especially valuable for heterogeneous samples, like biological tissues, composite materials, or artworks. With each pixel in the image representing a Raman spectrum, researchers can get both spatial and molecular information, revealing the distribution of different components or phases within the sample.
Temperature-dependent Raman Studies
Studying how materials behave under varying temperatures can yield crucial insights into their stability, phase transitions, and thermally-induced chemical changes. Temperature-dependent Raman studies involve acquiring Raman spectra of a sample at different temperatures, either by heating or cooling.
By monitoring how the Raman peaks shift, intensify, diminish, or even disappear with temperature changes, researchers can infer information about thermal expansion, phase changes (like from solid to liquid), or the breaking/forming of molecular bonds. This has significant implications in materials science, studying polymers, crystalline materials, and even biological samples to understand temperature-induced structural transformations.
Pressure-dependent Raman Studies
Raman spectroscopy under varying pressures, known as pressure-dependent Raman studies, probes the effects of external pressures on the molecular structures and properties of materials. This technique is particularly insightful for studying phase transitions, compressibility, and the structural stability of materials under extreme conditions.
Using specialized equipment, namely diamond anvil cells (DAC), samples can be subjected to very high pressures, often reaching hundreds of gigapascals (GPa). As the pressure is increased, Raman spectra are recorded to observe how the vibrational frequencies shift and how the peak intensities and shapes change.
Such studies have several applications:
Phase Transitions: Under high pressures, many materials undergo phase transitions, shifting from one structural form to another. These transitions are often evident in Raman spectra as the appearance or disappearance of specific peaks.
Molecular Bond Studies: As pressure increases, molecular bonds can be compressed, leading to changes in bond lengths and angles. Raman spectroscopy can detect these changes through shifts in vibrational frequencies.
Materials Science: Pressure-dependent Raman studies play a pivotal role in designing and understanding materials that might be used in high-pressure applications, like deep-sea equipment or aerospace components.
Geological Insights: Given that many minerals and rocks deep within Earth are subjected to immense pressures, this technique offers a window into understanding the Earth’s interior, simulating conditions of the deep mantle or even the core.
Discovery of Novel Phases: High pressures can lead to the formation of novel material phases with unique properties, and Raman spectroscopy serves as a tool to detect and study these phases.
Emerging Trends in Raman Spectroscopy
Raman spectroscopy, once a niche analytical technique, has evolved tremendously, especially in the last couple of decades. This evolution is driven by advances in technology, software, and an increasing appreciation for the technique’s potential across diverse sectors.
Tip-Enhanced Raman Spectroscopy (TERS)
Combining scanning probe microscopy with Raman, TERS offers nanoscale spatial resolution, pushing the boundaries of Raman beyond the diffraction limit. This is particularly impactful in studying nanomaterials, semiconductors, and biological samples.
Portable and Handheld Devices
Advances in miniaturization and technology have enabled the development of portable Raman spectrometers. These are being used in fields like forensic science, art conservation, and on-site geological studies.
Deep Learning and AI
Modern software harnesses artificial intelligence to better analyze and interpret Raman spectra, improving accuracy, and reducing analysis time.
Hybrid Techniques
Combining Raman with other spectroscopic or microscopic techniques, such as fluorescence microscopy or infrared spectroscopy, provides multi-modal information from a single sample.
The Future of Raman Spectroscopy
As technology continues to advance, the future of Raman spectroscopy looks promising:
Integration with Automation
Automated Raman systems, when combined with robotics, can speed up high-throughput analyses, especially in pharmaceuticals and materials research.
Biomedical Imaging
The non-invasive nature of Raman makes it a candidate for in-vivo biomedical imaging, potentially aiding in surgeries or disease diagnostics.
Space Exploration
With its ability to analyze geological samples without elaborate preparation, Raman instruments might find their way into future planetary rovers for space missions.
Environmental Monitoring
Real-time, continuous monitoring of environmental pollutants using Raman spectrometers can offer timely insights to tackle pollution.
Limitations of Raman Spectroscopy
While Raman spectroscopy offers a plethora of advantages and has wide-ranging applications, these limitations highlight the importance of proper sample preparation, instrument calibration, and sometimes the need for complementary techniques to obtain comprehensive information.
Fluorescence Interference
One of the primary challenges faced in Raman spectroscopy is the interference from fluorescence. Many samples, especially biological or organic ones, can fluoresce when exposed to laser light. The fluorescence background can be significantly more intense than the Raman signal, masking the desired information.
Sample Damage
High laser powers, particularly with samples sensitive to light or heat, can lead to sample degradation or damage. Care must be taken to balance the need for a good signal with the potential for sample alteration.
Weak Signal
Raman scattering is inherently weak. Thus, acquiring a high-quality spectrum from samples with low concentrations or weak Raman scattering efficiencies can be challenging and time-consuming.
Limited Sensitivity to Certain Groups
While Raman is sensitive to certain molecular vibrations, it may not effectively detect vibrations that don’t induce a change in polarizability. For instance, certain symmetric vibrations may be “Raman silent.”
Instrumental Limitations
High-resolution Raman measurements require precise and stable instrumentation. Factors such as instrument drift, laser instability, or misalignment can affect the quality and reproducibility of the Raman spectra.
Challenges with Highly Reflective or Refractive Samples
Samples that are highly reflective or refractive can pose challenges due to scattering of the laser light, which can affect the quality of the acquired spectra.
Overlapping Bands
In complex mixtures or samples with multiple components, the Raman bands may overlap, making it challenging to deconvolute and assign individual bands to specific molecular vibrations.


